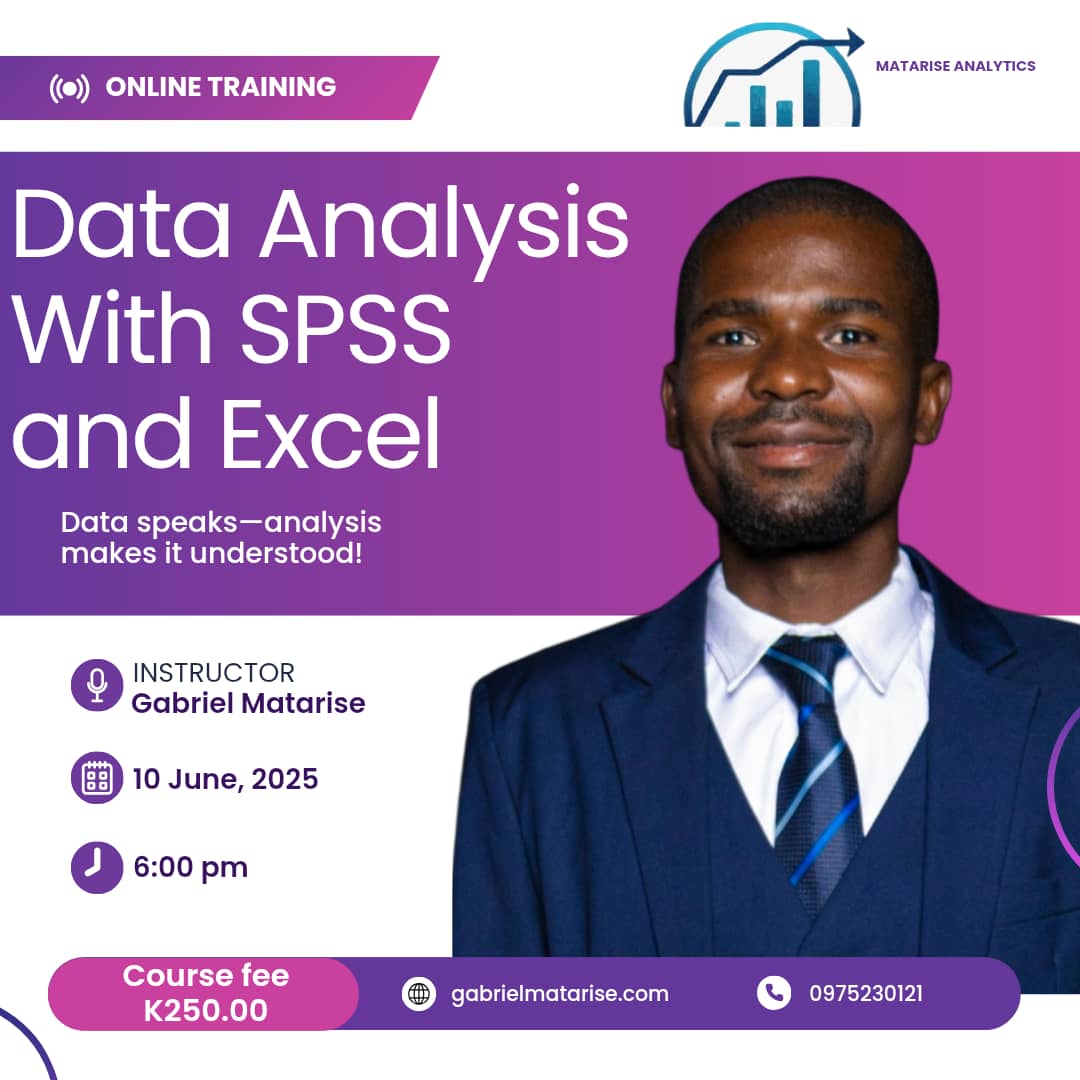
Course Detail
Data Analysis with SPSS and Excel

Course Overview: Data Analysis with SPSS and Excel
Our Data Analysis with SPSS and Excel course is a comprehensive, hands-on program designed for beginners and professionals who want to master data analysis for research, academic, or business applications. This course will equip you with the practical skills needed to manage, analyze, and interpret data confidently using two of the most widely used tools in the field — SPSS and Microsoft Excel.
Mode of Instruction: 100% Online
Duration: 3 Weeks
Delivery: Live Zoom Sessions, Recorded Video Lessons, Hands-on Projects, Downloadable Materials, and Quizzes.
What You'll Learn Week by Week:
Week 1: Foundations of Data Analysis
- Understanding types of data and variables
- Introduction to SPSS and Excel interfaces
- Data entry, data cleaning, and coding
- Descriptive statistics (mean, median, mode, standard deviation)
- Visualizing data using charts and graphs
Week 2: Inferential Statistics and Hypothesis Testing
- Understanding statistical concepts: population, sample, p-values
- Conducting t-tests (independent and paired)
- Chi-square tests for categorical data
- Correlation analysis (Pearson and Spearman)
- Interpreting outputs and drawing conclusions
Week 3: Real-World Projects and Advanced Analysis
- Regression analysis
- ANOVA
- Creating professional tables and reports for research or decision-making
- Final project: Analyze a dataset and present your findings
- Tips on freelence
Why Join This Course?
- Live mentorship and Q&A sessions with the instructor
- Access to recorded lessons and resources
- Certificate of Completion
- Access to a private community of learners and professionals
- Practical assignments to build your portfolio
Whether you're a student, researcher, or professional, this course will give you the confidence and skills to analyze data with clarity and accuracy. By the end of the 3 weeks, you will be able to conduct meaningful data analysis and create compelling data-driven reports.